Method
This page documents the complete forecasting methodology for both the Men’s and Women’s 2026 NCAA Tournament tracks. It covers how the project was built, the problem structure, data sources, modeling approach, bracket policy, and portfolio construction logic that underpin the submitted entries.
For live tournament state and per-track bracket analysis, see the Men’s Forecast and Women’s Forecast pages. For model diagnostics and calibration detail, see the Technical Reports.
P — How This Project Was Built
This project was constructed across eight bounded implementation stages, each closed and validated before the next began. The structure reflects a deliberate choice: rather than building a monolithic forecasting system in one pass, each stage had a defined scope, produced a validated output artifact, and was explicitly signed off before context cleared.
The problem this solves
Running a March Madness forecasting project end-to-end involves a chain of decisions that are easy to blur: what data to use, which models to trust, how to turn match probabilities into a bracket, and how to build a portfolio of entries that diversifies intelligently across scenarios. A single undisciplined implementation risks making implicit choices at each step that are hard to audit or reproduce. The bounded-stage approach forces every choice to be documented, evidence-tagged, and separated from the next.
Stage-by-stage build narrative
Stage 1 — Source and scope audit: The first question was: what public data exists for the men’s and women’s tournament histories? The answer differed substantially by track. Barttorvik (T-Rank) provides deep adjusted efficiency data for the men’s tournament (2008–2025, ~12 folds, 755 games). The women’s track has no comparable public source — Sports Reference SRS covers the broadest historical window and became the primary women’s signal. This asymmetry shaped every downstream decision.
Stage 2 — Data ingestion: Historical tournament game records were loaded from raw Torvik and Sports Reference snapshots, normalized into per-game records, and versioned in data/raw/. The 2020 season (no tournament) was excluded from the men’s evaluation window.
Stage 3 — Feature construction: Features are computed as team-A minus team-B differentials so the model operates on game-level contrast, not absolute team quality. For men: BARTHAG differential, adjOE differential, adjDE differential, seed difference. For women: SRS differential (primary), with expanded efficiency metrics tested in a challenger pass. All features are documented in section B.
Stage 4 — Model training and evaluation: All models were evaluated using expanding-window cross-validation — the only evaluation scheme that matches the actual deployment scenario (train on all history before year Y, evaluate on year Y’s tournament). A model ladder was built incrementally: start from baselines (seed history, single-scalar efficiency), then add features in steps, gating each step on held-out proper-scoring metrics (log loss and Brier score). This is detailed in sections E and the Technical Reports.
Stage 5 — 2026 predictions: The canonical men’s model (FM-01) and women’s model (W-LEG-FM-01) were applied to 2026 matchup features to produce per-matchup win probabilities for every possible first-round matchup. These probabilities form the input to the bracket simulation.
Stage 6 — Bracket simulation: 10,000 full-tournament Monte Carlo simulations were run per bracket policy. Each simulation samples each game’s outcome from the predicted probability, records a complete 63-pick tournament path, and computes the SCN-01 score. The policy that maximizes expected score across all 10,000 paths is selected as the submitted bracket.
Stage 7 — Portfolio construction: A diversified 10-entry portfolio was built from the simulation pool using explicit diversification rules (see section G). The portfolio provides partial insurance against any single champion path failing — if the anchor entry’s champion pick is eliminated, a diversified entry with a different champion may survive.
Stage 8 — Public export and live monitoring: Notebooks, data artifacts, and an SVG bracket figure were exported to a Quarto website. A live-monitoring layer was initialized with First Four results (4 games), and the R64 realized-results ingestion step is the first post-tournament data pipeline task.
AI-assisted construction and bounded-task discipline
This project was built using a three-role AI-assisted workflow:
- Scaffolder: defined project structure, governance rules, and task-family boundaries at initialization.
- Supervisor: a long-context model (ChatGPT Extended Thinking) that held project state across passes and adjudicated scope questions.
- Executor: a coding agent (Claude Code Sonnet 4.6) that implemented bounded tasks within the governance structure.
This division of roles is not incidental — it is why the bounded-task discipline was a practical requirement, not just a methodological preference. AI coding agents work most reliably within narrow, well-specified scopes. A task without clear entry and exit criteria will drift; a task without explicit non-scope boundaries will expand; a task without a validation plan will terminate without evidence of correctness. The supervisor maintained the governance structure across passes; the executor operated within it.
The entire project — from source audit through portfolio construction, public export, and live monitoring initialization — was completed in approximately three days for the men’s bracket and 3.5 days for the women’s bracket (beginning 2026-03-16). The speed came not from cutting corners but from not repeating work: each bounded pass had one clear deliverable, one validation check, and one context-clear gate before the next pass began.
Repo operating rules
The repo was managed under a strict bounded task family discipline throughout construction:
- Each stage entered through a handoff document in
handoffs/with a defined scope, blocker list, acceptance criteria, and validation plan. - Every substantive claim in project docs is tagged with evidence level:
[E]directly evidenced ·[I]strong inference ·[U]unresolved - No implementation proceeded without an active handoff document and evidence that the prior stage was validated.
- If canonical docs and code artifacts disagreed, the discrepancy was logged before proceeding.
docs/is the canonical project memory;data/outputs/holds the artifact record;handoffs/defines the execution boundary.
This discipline is why the methodological claims on this page can be traced to specific CSV artifacts in data/outputs/, specific model evaluation rows, and specific handoff documents — not to narrative memory or approximation.
A — Defining the Problem
The March Madness forecasting problem is commonly framed as “predict who wins each game.” That framing is incomplete. The actual objective depends on the scoring system under which the bracket is evaluated.
The ESPN Tournament Challenge scoring system (SCN-01)
Every entry in this forecast was evaluated under the standard ESPN Tournament Challenge scoring rule — called SCN-01 in this repo:
| Round | Games | Points per correct pick | Round maximum |
|---|---|---|---|
| Round of 64 (R64) | 32 | 10 | 320 |
| Round of 32 (R32) | 16 | 20 | 320 |
| Sweet 16 (S16) | 8 | 40 | 320 |
| Elite Eight (E8) | 4 | 80 | 320 |
| Final Four (F4) | 2 | 160 | 320 |
| Championship | 1 | 320 | 320 |
| Total | 63 | 1,920 |
Points double with each round. A correct championship pick (320 pts) is worth 32 correct first-round picks. A correct Final Four pick (160 pts) is worth 16. This exponential structure means that the optimal bracket is not “pick the most likely winner every game” — it is the bracket that maximizes expected score, accounting for how each pick affects the probability of earning later-round points.
Why bracket construction is a policy problem
Consider a team with 70% probability of reaching the Final Four and 35% probability of winning the championship. Picking them as champion earns 320 points with 35% probability. But picking them only to the Final Four earns 160 points with 70% probability. Expected values: 112 vs. 112. Now add the downstream games: a team picked as champion must be picked correctly at every earlier round, which multiplies their expected contribution. The tradeoff between reach and reward is nontrivial.
This is the bracket policy problem: given a full probability surface over all matchups, which bracket maximizes expected SCN-01 score? The answer is found by simulation — not by greedy per-game selection. This is why a separate “bracket policy” layer sits on top of the matchup model in this project.
B — Data Sources and Metrics
Men’s track: Torvik efficiency data
The men’s historical feature backbone was built from Barttorvik.com data — commonly called Torvik or T-Rank data. This source provides adjusted per-possession efficiency metrics for NCAA Division I men’s basketball programs across multiple seasons.
Historical snapshots cover 2008–2025 (the 2020 season was excluded due to the cancelled tournament), giving an expanding-window evaluation over 755 historical tournament games across 12 folds.
Core efficiency metrics used:
| Metric | Definition |
|---|---|
| BARTHAG | Estimated probability of beating an average D1 opponent on a neutral court. A composite power rating. |
| adjOE | Adjusted offensive efficiency — points scored per 100 possessions against an average schedule |
| adjDE | Adjusted defensive efficiency — points allowed per 100 possessions against an average schedule |
| adjT | Adjusted tempo — possessions per 40 minutes against an average schedule |
Four Factors metrics (tested, not promoted to primary):
| Metric | Definition |
|---|---|
| eFG% off/def | Effective field-goal percentage (weights 3-pointers 1.5×), offense and defense |
| TO% off/def | Turnover rate per possession, offense and defense |
| OR% / DR% | Offensive and defensive rebound rate |
| FTR off/def | Free-throw rate (FTA/FGA), offense and defense |
All features are computed as team-A minus team-B differentials so the model is game-level rather than team-level. Seed difference is included in the core block as a compressed ordinal signal for committee ranking.
Women’s track: SRS and expanded efficiency
The women’s historical backbone is materially thinner. Advanced efficiency data with full historical coverage comparable to Torvik’s men’s dataset does not exist at the same depth.
The primary strength scalar for the women’s model is Sports Reference SRS (Simple Rating System) — a strength-of-schedule-adjusted point margin per game. SRS has broader historical coverage for the women’s tournament than per-possession efficiency metrics.
Where available, adjusted offensive and defensive efficiency were tested (expanded backbone, W-FM-03 model family), as were Four Factors metrics. Coverage gaps limited the usable historical sample on the expanded features, making the legacy SRS-based block more robust on the broadest evaluation window.
Evaluation backbone: ~600 historical tournament games across 10 expanding-window folds (approximately 2016–2025 women’s tournament history).
Historical data provenance
All historical data used for model training was drawn from public sources (Torvik, Sports Reference) and stored in data/raw/ as versioned snapshots. No external picks, odds, or market data were used at any stage.
Feature selection rationale — Men’s track
The feature set for the men’s model was built from Torvik-derived team-strength and efficiency signals. The choice was driven by held-out proper-scoring performance, not by feature breadth.
Why seed alone is not enough
Seed encodes the selection committee’s strength ranking and correlates strongly with tournament outcomes. But seed is a compressed ordinal signal: it does not distinguish between a dominant 1-seed and a weak 1-seed, and it says nothing about how a team wins. The BARTHAG baseline alone (BL-03) already outperforms the historical seed-pair win-rate baseline (BL-02) by about 0.048 on held-out log loss and 0.013 on Brier score. That gap establishes that a single compressed efficiency scalar — even used naively — already captures substantial predictive signal beyond what seeds encode.
Why the core efficiency block was the decisive addition
Moving from BL-03 (BARTHAG only) to FM-01 (BARTHAG + adjOE + adjDE + seed) produced the largest single improvement in the model ladder: approximately 0.056 on held-out log loss and 0.022 on Brier score. That is more than twice the improvement from adding any subsequent feature block. Seed and BARTHAG are themselves strongly correlated (~−0.83), which means the core block provides structured, partially redundant but complementary evidence about team quality — not independent votes.
Why Four Factors were tested but not promoted
The Four Factors (eFG%, TO%, OR/DR%, FTR) describe the basketball mechanisms behind team strength. They were tested as FM-03 (core + Four Factors). The held-out result: FM-03 worsened held-out log loss by 0.0005 and increased the train-test overfit gap from ~0.0001 to 0.016 relative to FM-01. The richer description did not produce a generalizable forecasting gain under the current training sample. Four Factors remain valuable as interpretation — they explain why a team is strong — but not as operational forecasting improvement over the simpler core block.
Why context features were not promoted
Context features (travel distance differential, quasi-home indicators) were tested as FM-02b (core + context). The held-out result: FM-02b slightly worsened log loss by 0.002 relative to FM-01. Context is useful for sensitivity analysis and interpretation, but the current sample does not support operational promotion.
Full metric definitions — Men’s track
| Metric | Definition |
|---|---|
| BARTHAG | Torvik’s power rating — estimated probability of beating average D1 team on neutral court |
| adjOE | Adjusted offensive efficiency (points scored per 100 possessions vs. average schedule) |
| adjDE | Adjusted defensive efficiency (points allowed per 100 possessions vs. average schedule) |
| adjT | Adjusted tempo (possessions per 40 minutes) |
| eFG% off/def | Effective field goal percentage accounting for 3-pointers, offense/defense |
| TO% off/def | Turnover rate per possession, offense/defense |
| OR%/DR% | Offensive/defensive rebound rate |
| FTR off/def | Free throw rate (FTA/FGA), offense/defense |
Seed is included in the model as seed_diff (higher seed = lower number = stronger team). All features are computed as team-A minus team-B differentials, making the model game-level rather than team-level.
Feature selection rationale — Women’s track
The women’s data backbone
The women’s historical backbone is materially thinner than the men’s. The primary differences:
- Source coverage: Women’s advanced efficiency data (comparable to Torvik’s men’s ratings) is less complete historically. The initial women’s feature set used Sports Reference SRS (Simple Rating System) as the primary strength scalar, supplemented by available efficiency signals where coverage allowed.
- Evaluation window: The expanding-window framework covers 10 folds across 600 historical games — versus 12 folds and 755 games on the men’s side. The women’s evaluation is structurally similar but has less historical depth.
- Feature richness: The women’s model roster was more constrained by available data. A full Four Factors + context expansion comparable to the men’s FM-03/FM-04 ladder was tested on a narrower backbone, making some comparisons less stable.
Why the legacy feature block won
The strongest single women’s scalar in the initial ladder was sportsref_srs_diff — the Sports Reference SRS differential. This is a strength-of-schedule-adjusted point margin signal rather than a full efficiency decomposition. The legacy feature block (W-LEG-FM-01) uses this as its primary signal. When tested on the full-history expanding-window evaluation, the legacy block outperformed the expanded-backbone model (W-FM-03) on held-out log loss and Brier score.
Why the women’s metric definitions differ from men’s
The core women’s model does not have a direct BARTHAG equivalent with the same historical coverage. The women’s version uses SRS differential as the primary compression of team strength. SRS encodes winning margin, schedule strength, and in-conference performance — a somewhat coarser signal than BARTHAG but one with broader historical coverage for the women’s tournament.
Where efficiency signals (adjOE, adjDE) were available, they were tested in the expanded backbone. They improved fit in the expanded window but did not consistently dominate the legacy feature block across the broadest evaluation window.
Metric definitions — Women’s track
| Metric | Definition | Coverage in women’s model |
|---|---|---|
| SRS | Simple Rating System — strength-of-schedule adjusted point margin | Primary signal in W-LEG-FM-01 |
| adjOE | Adjusted offensive efficiency | Available in expanded backbone (W-FM-03) |
| adjDE | Adjusted defensive efficiency | Available in expanded backbone (W-FM-03) |
| eFG% off/def | Effective field goal %, offense/defense | Available but coverage gaps |
| TO% off/def | Turnover rate per possession | Available but coverage gaps |
| OR%/DR% | Offensive/defensive rebound rate | Available but coverage gaps |
| FTR off/def | Free throw rate | Available but coverage gaps |
Coverage gaps mean the women’s feature set is more constrained than the men’s by data availability, not by modeling choice.
C — Workflow and Repo Operating System
This project is organized as a sequence of bounded task families rather than a single monolithic pipeline. Each task family has a defined handoff document, a bounded scope, and a validation record before the context is cleared.
Allowed task-family modes: - audit — inventory and classify existing artifacts - classify — identify canonical vs. provisional artifacts - specify — define schemas and expected outputs - implement narrowly — add code or content within a bounded scope - validate — verify artifact conformance to specification - checkpoint — update status docs and ledger before closing
Source-of-truth rules: - docs/ is canonical project memory once populated - handoffs/ defines the execution boundary for each bounded pass - No implementation proceeds without an active handoff document - If canonical docs and code artifacts disagree, the discrepancy is flagged before proceeding
Evidence tagging: All substantive claims in project docs are marked with: - [E] — directly evidenced from repo artifacts or canonical docs - [I] — strong inference from those artifacts - [U] — unresolved / uncertain
This tagging discipline prevents claims from drifting from their evidence base as the repo evolves across passes.
D — Build Stages
The project was built across eight implementation stages, each validated before the next began:
| Stage | Description | Key artifacts |
|---|---|---|
| 1. Source / scope audit | Identify canonical data sources for men and women | docs/01_source_of_truth_and_provenance.md |
| 2. Data ingestion | Load and normalize historical Torvik/SRS snapshots | data/raw/torvik_*.csv, data/raw/factors/ |
| 3. Feature construction | Build per-game differential feature matrices | data/outputs/features_*.csv |
| 4. Model training and evaluation | Expanding-window cross-validation across model family | data/outputs/expanded_aggregate_metrics.csv, data/outputs/womens_aggregate_metrics.csv |
| 5. 2026 predictions | Apply canonical models to 2026 tournament matchups | data/outputs/predictions_2026_fm01.csv, data/outputs/womens_predictions_2026.csv |
| 6. Bracket simulation | 10,000 Monte Carlo bracket simulations per policy | data/outputs/bracket_simulation_summary.csv, data/outputs/simulation_game_outcomes_bp01.csv |
| 7. Portfolio construction | Multi-entry bracket book with diversification rules | data/outputs/multi_entry_portfolio_summary.csv, data/outputs/multi_entry_portfolio_picks.csv |
| 8. Public export | Export notebooks, data, and site for public hosting | site/public_data/, site/marimo/ |
A live-monitoring stage (stage 8b) was also initialized: data/outputs/live_monitoring_summary.csv tracks realized First Four results against FM-01 predictions. A full R64 results ingestion pass is the next major data-pipeline step.
E — Model Ladder and Selection
The modeling approach follows a model ladder discipline: start from a well-understood baseline, add features in increments, and gate each addition on held-out proper-scoring metrics (log loss and Brier score). A model is only promoted when it demonstrates a consistent held-out improvement — not merely a training improvement.
All models were evaluated using expanding-window cross-validation: train on all data before year Y, evaluate on year Y’s tournament games, then advance the window. This matches the deployment scenario — the model never sees future-tournament games during training.
Men’s model ladder
Evaluation backbone: 12 folds, 755 historical games (2008–2025, excluding 2020)
Baseline models:
| Model | Description | Held-out log loss | Held-out Brier |
|---|---|---|---|
| BL-01 | Strict seed favorite | ~3.98 | 0.291 |
| BL-02 | Historical seed-pair win rate | 0.591 | 0.197 |
| BL-03 | BARTHAG-only logistic | 0.543 | 0.184 |
BL-01 is a degenerate model: log loss near 4 because it assigns probability 1 to the favorite, which punishes misses severely. BL-02 is more honest. BL-03 — a single efficiency scalar — already beats the seed-history heuristic by 0.048 log loss, establishing that advanced efficiency carries real signal beyond seeds.
Logistic regression family:
| Model | Features | Held-out log loss | Held-out Brier | Overfit gap |
|---|---|---|---|---|
| FM-01 | Core (BARTHAG + adjOE + adjDE + seed) | 0.4869 | 0.1620 | 0.0001 |
| FM-03 | Core + Four Factors | 0.4874 | 0.1631 | 0.0157 |
| FM-02b | Core + context (travel) | 0.4888 | 0.1626 | — |
| FM-04 | Core + Four Factors + context | 0.4898 | 0.1637 | 0.0212 |
| FM-02a / FM-02c | Four Factors / Four Factors + context, no core | 0.59 | 0.20 | — |
The single largest improvement in the ladder was adding the core efficiency block (BL-03 → FM-01): ~0.056 log loss improvement. Four Factors and context features provided minimal additional held-out gain while increasing overfit risk. FM-02a/FM-02c (no core block) collapse to near-BL-02 performance, confirming BARTHAG + adjOE + adjDE are foundational.
Bounded nonlinear comparators:
| Model | Held-out log loss | Held-out Brier | Train-test gap |
|---|---|---|---|
| NL-01 (Random Forest) | 0.5237 | 0.1749 | 0.069 |
| NL-02 (HistGradientBoosting) | 0.5378 | 0.1785 | ~0.203 |
Both nonlinear models trail FM-01 on held-out metrics and carry substantially larger overfit gaps. Neither is a serious challenger under the current training sample.
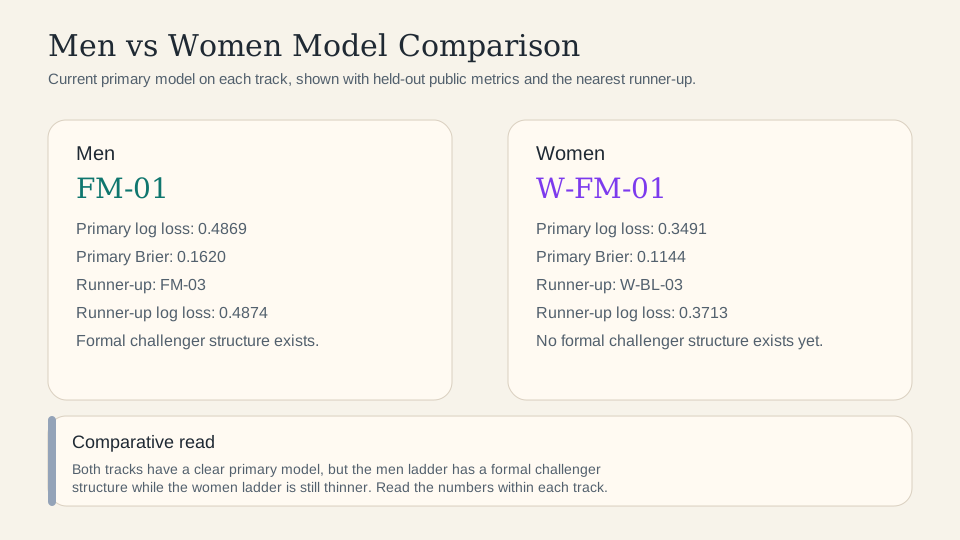
Primary model selected: FM-01. Lowest held-out log loss (0.4869), lowest Brier (0.1620), smallest overfit gap (~0.0001). FM-03 is the formal sensitivity challenger (log loss 0.4874, margin within fold noise), used for the one FM-02 sensitivity entry in the portfolio.
Women’s model ladder
Evaluation backbone: 10 folds, ~600 historical games
Baseline models:
| Model | Description | Held-out log loss | Held-out Brier |
|---|---|---|---|
| W-BL-01 | Strict seed favorite | ~2.86 | 0.207 |
| W-BL-02 | Historical seed-pair win rate | 0.467 | 0.146 |
| W-BL-03 | BARTHAG-equivalent logistic | 0.503 | 0.163 |
| W-LEG-BL-03 | Legacy SRS-based logistic baseline | 0.371 | 0.122 |
W-LEG-BL-03 — using SRS differential as a single scalar — already outperforms the BARTHAG-equivalent baseline by 0.132 log loss. This confirms that SRS is the dominant strength signal on the women’s historical backbone.
Logistic family:
| Model | Description | Held-out log loss | Held-out Brier | Accuracy |
|---|---|---|---|---|
| W-LEG-FM-01 | Legacy feature block (primary) | 0.3491 | 0.1144 | 82.3% |
| W-FM-03 | Expanded efficiency backbone | 0.3519 | 0.1147 | 82.3% |
| W-FM-01 | Standard efficiency logistic | 0.3733 | 0.1224 | 81.8% |
| W-FM-02 | Extended feature logistic | 0.3835 | 0.1259 | 81.0% |
Four separate evaluation passes consistently placed W-LEG-FM-01 at or ahead of W-FM-03 on the broadest held-out window:
- Full-history ladder: W-LEG-FM-01 > W-FM-03 on both log loss and Brier score
- Targeted-challenger pass: W-LEG-FM-01 > W-FM-03 > W-FM-04a/4b/4c
- NET-era pass (2022–2025): W-FM-03 leads on the narrower NET window — but this window is smaller and the comparison is less stable
- Governance decision: Broadest full-history window takes precedence; W-LEG-FM-01 is canonical primary, W-FM-03 is formal challenger
The NET-era result does not overturn the overall ranking because the NET-era window is narrower by construction. When windows disagree, the broadest window takes governance precedence.
Primary model selected: W-LEG-FM-01. W-FM-03 is the formal challenger model.
Men vs. Women model comparison
The women’s primary model achieves lower absolute log loss (0.3491 vs. 0.4869). This does not indicate a better model — it reflects the women’s tournament being more top-seed-dominant historically, making the prediction task structurally easier. Within-track comparison is the relevant one for each model.
F — Bracket Policy and Scoring
Why the bracket policy is a separate layer from the matchup model
The matchup model (FM-01, W-LEG-FM-01) answers one question: given two teams in a specific matchup, what is the probability that team A beats team B? It has no concept of bracket structure, round positions, or scoring rules.
The bracket policy answers a different question: given the full matchup probability surface for a tournament, which complete bracket maximizes expected SCN-01 score? These are separable problems. The same matchup model can be evaluated under different scoring scenarios or bracket strategies by swapping the policy layer without retraining.
How BP-01 works (men’s primary policy)
- Run 10,000 full-tournament simulations using FM-01 matchup probabilities, sampling each game’s outcome stochastically from the predicted probability.
- For each of the 10,000 simulated tournament paths, compute the SCN-01 score that a hypothetical bracket would earn if it had picked correctly for that path.
- The bracket
BP-01is the one that maximizes expected SCN-01 score across all 10,000 simulations — the bracket that would have earned the most points on average.
This simulation-based approach automatically handles path dependencies: a team picked to advance to the championship also needs to be picked to win every earlier round, so the simulation jointly optimizes the entire 63-pick bracket.
BP-01 vs. BP-chalk
BP-chalk is the simpler deterministic baseline: pick the FM-01 modal winner (highest single-game probability) in every game. For the men’s track:
| Policy | Model | Ex ante E[score] (SCN-01) | Champion |
|---|---|---|---|
| BP-01 | FM-01 | 1,184.2 | Duke |
| BP-chalk | FM-01 | 1,183.3 | Duke |
| BP-02-sensitivity | FM-02 | 1,171.5 | Duke |
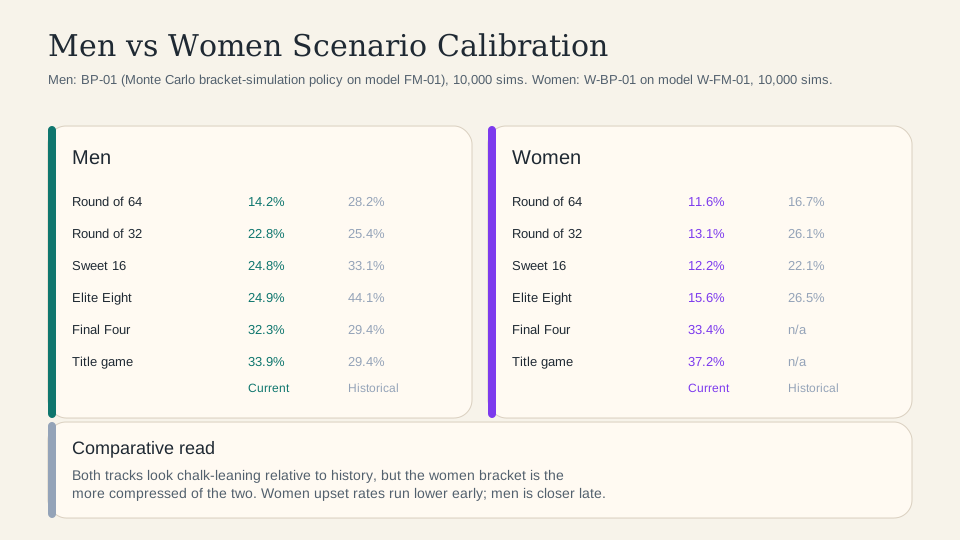
The gap between BP-01 and BP-chalk is 0.87 points — small but consistent. BP-01 picks slightly off the chalk in a handful of games where the simulation shows the expected-score benefit of a non-modal pick exceeds the probability cost.
For the women’s track, W-BP-01 and W-BP-chalk produce the same bracket (W-E01): the top-seed dominance in the women’s probability surface is strong enough that the simulation-optimizing policy and the greedy-chalk policy agree on all meaningful picks.
G — Entry and Portfolio Construction
What an entry is
An entry is one complete bracket — 63 game predictions spanning Round of 64 through Championship. Each entry is scored independently under SCN-01. In a multi-entry contest, the portfolio’s result is the best single-entry score across all submitted entries.
Why a portfolio
A single bracket submitted under a stochastic scoring rule will, at best, realize its expected score on average across many tournaments. In any single tournament, variance is large. A portfolio of diverse brackets provides partial insurance: if the anchor entry’s champion pick fails, an alternative entry with a different champion may survive.
Diversification is only valuable if the entries are genuinely different — not cosmetically different by one pick in the first round. The portfolio construction rules in this project enforce structural diversity.
Men’s portfolio construction (10 entries)
Sleeve structure:
| Sleeve | Entries | Logic |
|---|---|---|
| PF-00 — Chalk Anchor | E01 | FM-01 optimal bracket (BP-01). Highest expected score anchor. |
| PF-01 — FM-01 Diversified Core | E02–E09 | FM-01 simulation pool, greedy expected-score diversification. |
| PF-02 — FM-02 Sensitivity | E10 | FM-02 model path. Structural sensitivity to feature assumptions. |
Diversification rules enforced across the portfolio: - No duplicate full brackets - Every non-anchor entry must differ from E01 by ≥ 2 scorable picks, including ≥ 1 Round of 32 or later pick - Any two entries must differ from each other by ≥ 2 picks - With 8+ entries: ≥ 3 distinct champion picks required - No champion may occupy > 40% of entries
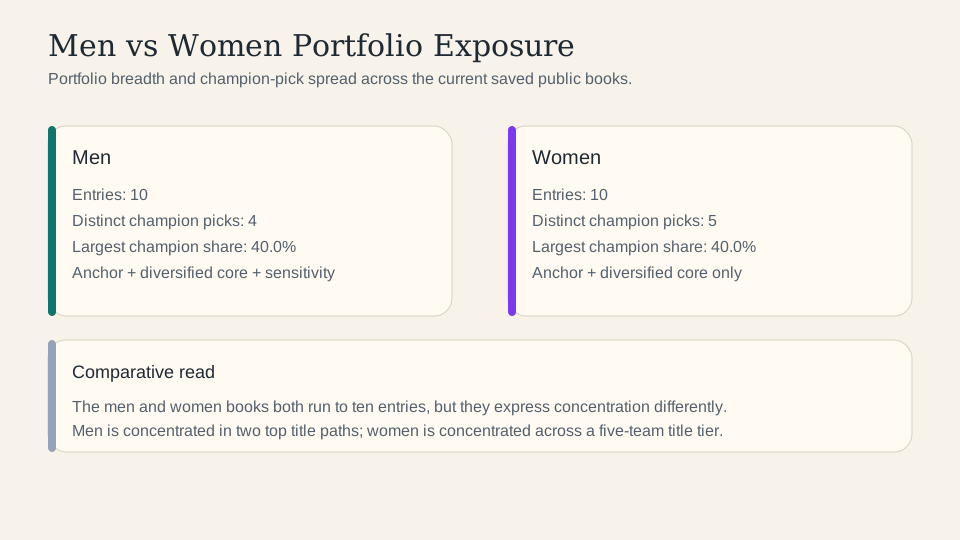
Men’s champion exposure (10 entries): Duke: 4 · Michigan: 4 · Arizona: 1 · Illinois: 1
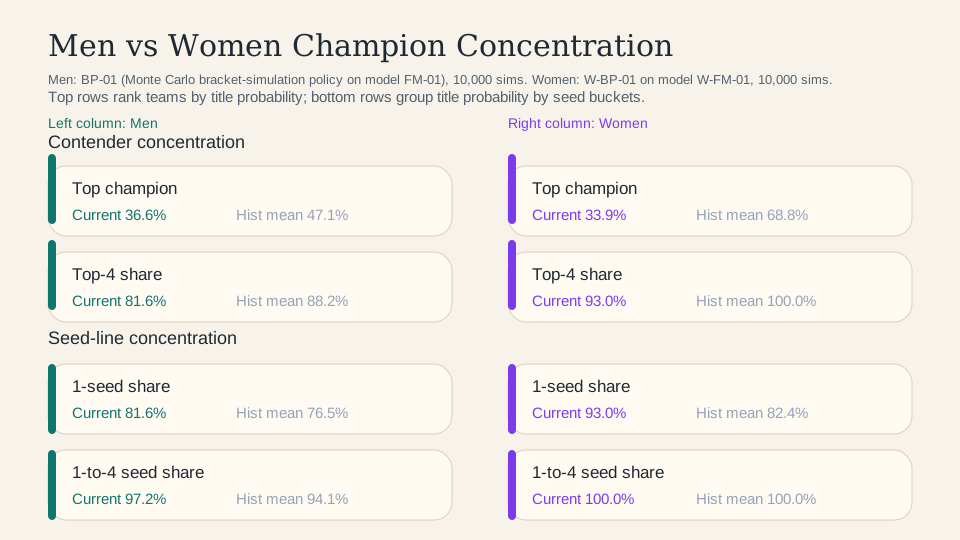
This mirrors the FM-01 probability surface (Duke 36.6%, Michigan 20.4%, Arizona 17.5%).
Women’s portfolio construction (10 entries)
Sleeve structure:
| Sleeve | Entries | Logic |
|---|---|---|
| W-PF-00 — Anchor | W-E01 | Deterministic W-LEG-FM-01 chalk anchor |
| W-PF-01 — Diversified Core | W-E02–W-E10 | W-LEG-FM-01 simulation pool, greedy diversification |
There is no W-FM-03 sensitivity sleeve in the current submitted portfolio. The W-FM-03 model was formally designated challenger after the portfolio was generated. A future pass would add W-FM-03 entries following the same diversification rules.
Women’s champion exposure (10 entries): UConn: 4 · Texas: 2 · UCLA: 2 · LSU: 1 · South Carolina: 1
H — Methodological Limits
What the current pipeline can justify
- Per-game win probabilities for all 2026 tournament matchups, calibrated on 10–12 years of historical expanding-window data.
- Ex ante expected scores under SCN-01 for each submitted entry, derived from 10,000 Monte Carlo bracket simulations.
- Pre-tournament advancement probabilities (champion, Final Four, Elite Eight) for each team, unconditional on realized results.
- First Four realized results: 4 games tracked in
live_monitoring_summary.csv(FM-01 went 1/4 on First Four predictions).
What is not yet in the repo
- Complete later-round direct prediction coverage: The repo does not yet publish a full direct pregame probability layer for every later-round game on both tracks. This is the main reason later-round model-vs-policy diagnosis remains partial, especially on the women’s side.
- A full public bracket-pool benchmark: The repo includes historical stage benchmarks and simulation-based expected scores, but it does not include an ESPN/public-pool distribution benchmark for locating an entry against the broader population of submitted brackets.
- A durable beyond-R32 live-refresh layer: The repo now includes canonical realized-results ingestion, conditioned advancement probabilities, and live-state outputs through the current R32-complete stage, but additional tournament rounds would still require rerunning the live refresh pipeline as new results arrive.
Known modeling limitations
- Chalk lean: BP-01 produces a bracket with a 14.2% R64 upset rate, well below the 28.2% historical benchmark. This is a structural consequence of training a proper-scoring model on historical data — high-variance upsets are penalized severely on individual misses, so the model learns conservative probabilities for lower seeds.
- Women’s backbone thinness: The women’s historical data is narrower and uses a coarser strength scalar (SRS vs. BARTHAG). Calibration claims for women are made more conservatively, and no historical upset-rate benchmark is available for direct comparison.
- No external signals used: No market odds, pick-popularity data, or crowd-sourced bracket information was used at any stage. The models are purely historical-efficiency based.
- Win probability only: The models predict binary game outcomes (win/loss probability), not score differentials. Differential-based models can provide richer signal on margin-of- victory structure and may calibrate upset rates more accurately.
Planned improvements for 2027 [I]
The following improvements are identified from the 2026 construction and tournament evaluation experience. None are implemented in the current repo; all are [I] inference from observed limitations.
- Expand historical feature coverage: Reconstruct missing efficiency metrics for earlier seasons; prioritize improving the women’s backbone toward men’s coverage depth where public sources allow.
- Score-differential targets: Predict score margin, not just binary win probability. This provides more calibrated upset-probability estimates and richer plausibility checks.
- Treat preseason information explicitly: The current pipeline ingests end-of-season efficiency ratings. Pre-tournament polling, early-season strength signals, and injury information are not modeled.
- Model travel and venue effects more carefully: The current context layer (FM-02b) provided minimal held-out improvement; a more principled travel/rest model may perform better with a larger historical sample.
- Bayesian modeling approaches: Formal Bayesian treatment of uncertainty would allow prior-posterior updating as tournament results arrive, replacing the approximate conditional-EV layer used for live state.
- Sex-specific model families: The current pipeline applies the same general logistic structure to both tracks. Structural differences between the men’s and women’s tournaments (top-seed dominance, program clustering, scoring pace) suggest track-specific architectures may be warranted.
- Expand women’s data backbone: The SRS scalar is coarser than BARTHAG; if per- possession efficiency data with broader historical women’s coverage becomes available, it should be evaluated under the same expanding-window discipline.
For live tournament state see Men’s Forecast and Women’s Forecast. For model diagnostics, calibration plots, and portfolio detail see Technical Reports.